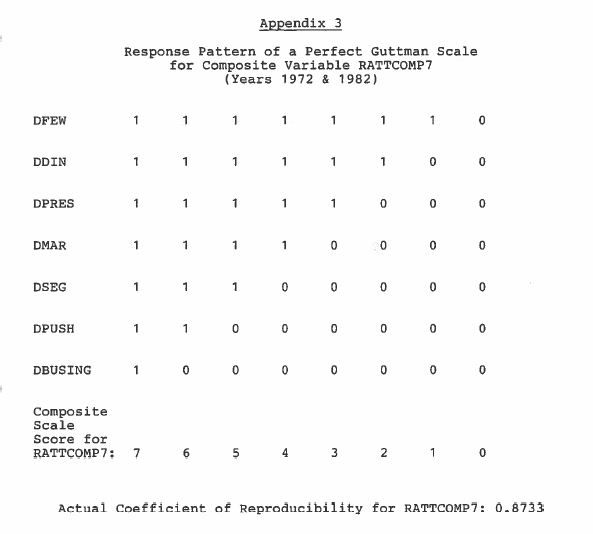
In statistical surveys conducted using structured interviews or questionnaires, a subset of the survey items having binary (e.g., yes or no) answers forms a Guttman scale (named after Louis Guttman); if they can be ranked in some order so that for a rational respondent, the response pattern can be captured by a single index on that ordered scale.
In other words, on a Guttman scale, items are arranged so that an individual who agrees with a particular item also agrees with items of lower rank order.
For example, a series of items could be
- I am willing to be near ice cream;
- I am willing to smell ice cream;
- I am willing to eat ice cream; and
- I love to eat ice cream.
Agreement with any item implies agreement with the lower-order items.
This contrasts with topics studied using a Likert scale or a Thurstone scale. The method of scaling devised by Guttman is also called scalogram analysis.
A well-known example of a Guttman scale is the Bogardus Social Distance Scale, which is as follows:
- Are you willing to permit immigrants to live in your country?
- Are you willing to permit immigrants to live in your community?
- Are you willing to permit immigrants to live in your neighborhood?
- Are you willing to permit immigrants to live next door to you?
- Would you permit your child to marry an immigrant?
The Guttman scale likewise applies to a series of items in other kinds of tests, such as achievement tests with binary outcomes.
For example, a math achievement test might order questions based on their difficulty and instruct the examinee to begin in the middle.
The assumption is if the examinee can successfully answer items of that difficulty (e.g., summing two 3-digit numbers), s/he would be able to answer the earlier questions (e.g., summing two 2-digit numbers).
Some achievement tests are organized in a Guttman scale to reduce the duration of the test.
By designing surveys and tests that contain Guttman scales, researchers can simplify the analysis of the outcome of surveys and increase the robustness.
Guttman scales also make it possible to detect and discard randomized answer patterns, as may be given by uncooperative respondents.
A hypothetical, perfect Guttman scale consists of a unidimensional set of items ranked in order of difficulty from least extreme to most extreme positions.
For example, a person scoring a “7” on a ten-item Guttman scale will agree with items 1-7 and disagree with items 8, 9,10.
An important property of Guttman’s model is that a person’s entire set of responses to all items can be predicted from their cumulative score because the model is deterministic.
An important objective in Guttman scaling is to maximize the reproducibility of response patterns from a single score.
A good Guttman scale should have a coefficient of reproducibility (the percentage of original responses that could be reproduced by knowing the scale scores used to summarize them) above .85.
Another commonly used metric for assessing the quality of a Guttman scale is Menzel’s coefficient of scalability and the coefficient of homogeneity (Loevinger, 1948; Cliff, 1977; Krus and Blackman, 1988).
To maximize unidimensionality, misfitting items are rewritten or discarded.
A scale is said to be unidimensional if the responses fall into a perfect pattern in which endorsement of the item reflecting the extreme position also results in endorsing all less extreme items.
With the Guttman technique, the ‘perfect’ implies that a person who replies to a given question favorably will have a higher score than someone who answers it unfavorably.
In this situation, the number of items endorsed by a respondent giving a complete picture of which items he agreed and disagreed with serves as his score.
If some combination of scores other than the desired combination forms a particular scale score, it is considered an error. The scale is inadequate if there are many scaling errors or exceptions to the desired pattern.
The attainment of a higher degree of unidimensionality is the major concern of the Guttman scale.
However, the Guttman scale belongs to the broad category of cumulating scaling.
It is cumulative in that the combination responses required to make a particular score include the responses to all questions required to make the next lower score, plus the response to one additional question, in a stepwise fashion.
According to Guttman, a ‘universe of content’ can be considered unidimensional only if it yields a perfect or nearly perfect cumulative scale.
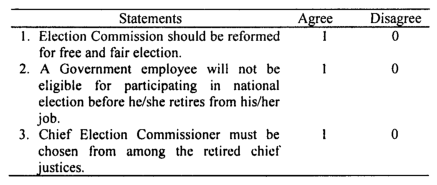
Suppose a survey is conducted among 100 respondents on the opinion of a new brand of shirt labeled ‘union.
A score enables one to determine which item is endorsed by the respondent. We may have developed a preference scale of 4 items as follows:

For example, a person with a score of 3 should disagree with item 4 but agree with all others. A score of 4 indicates all statements are agreed to and represent the most favorable attitude.
According to the scalogram theory, this pattern confirms that the universe of content (attitude toward an issue understudy) is scalable.
How is a score assigned to an individual?
A commonly used general solution is to assign to each individual a score equal to the number of items he endorses.
The respondents who participated in the survey indicate whether they agree or disagree with their opinions.
If these items form a unidimensional scale, the response pattern’ will form a perfect cumulative scale of the following type:
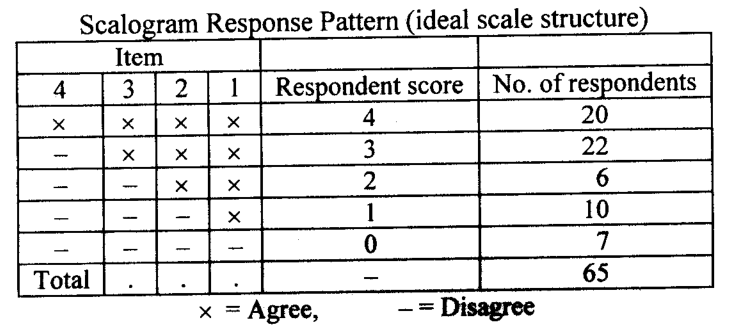
In the case of a non-perfect pattern, the respondents will act differently.
Such a pattern will be designated as a non-scale pattern. The number of respondents will be the remainder of those who followed the scale pattern as in the above table.
If there are 100 persons participating in the study and 65 responded according to the scale pattern, then the remaining 35 did respond differently, resulting in a non-scale pattern, which we categorize as errors.
The responses of this pattern may be as follows:
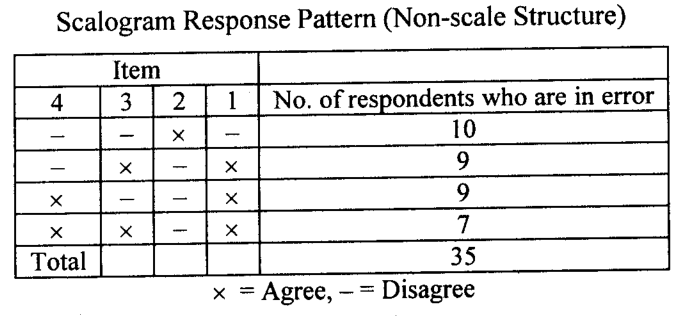
In the Guttman technique, the perfect scale implies that a person, who answers a given question favorably, will have a higher total score than someone who answers it unfavorably. In the first table, the four response patterns form a scalar pattern.
Suppose all the responses provided by the respondents form a scalar pattern (in which case there will be none to form the second table).
In that case, the items are said to form a perfect scale, and the resulting scale has been called by Guttman a “perfectly reproducible” one.
In the second table, the four rows constitute the non-scale patterns, and each of these patterns is associated with the error.
The Guttman scale is analytically complex, apart from the fact that there is no guarantee that the various items will scale. Even if they do so, the universe of the content may be narrow in coverage.
This method is more appropriate for scaling ordered behavior than less structured and broad¬based attitudes.
The reproducibility of the Guttman score can be examined by what is known as the coefficient of reproducibility (CR). The higher the value of the coefficient, the higher the proportion of scores we can reproduce accurately.
The coefficient is computed by subtracting the proportion of responses that are errors from 100 percent (all responses). The formula to be used is;

Another way of expressing CR is to say that the proportion of responses can be correctly predicted from the individuals’ total score.
A coefficient of reproducibility can also be calculated for each item individually as the proportion of responses on that item that are correctly predicted; CR is the simple average of these item coefficients.
In the foregoing example, E=35, N=100, n=4, so that;

Any reproducibility coefficient over 0.90 is supposedly adequate to indicate scalability and the ability to reproduce responses to the various items from the knowledge of the total score.
However, as Edwards (1957: 191) notes, a CR of 0.90 is not a sufficient condition for the scalability of a set of statements.
Cumulative Scale
On a cumulative scale, a respondent is given several questions to express his or her agreement or disagreement on an issue.
The items are arranged so that a respondent who responds favorably to item 2 also replies favorably to item 1, and one who replies favorably to item 3 also replies favorably to items 1 and 2, and so on.
In other words, it assumes a cumulative set of scores.
Therefore, the individuals who answer favorably have a higher total score than those who answer unfavorably.
An individual’s score is computed by counting the number of items he answers favorably. His scores indicate a particular position on the scale. The intervals between the positions may not be equal.
The items may be arranged front favorableness to unfavorableness in a systematic manner or may be randomly selected.
The cumulative type of scale was successfully used by Bogardus first, which is also known as Bogardus’s social distance scale.
The main purpose of this scab is to measure the attitude towards a particular ethnic group or group.
Several suggested relationships may be listed, to which members of an ethnic group (for example) may be accepted. The respondent is to indicate which racial group he will accept for each of the specified relationships.
The attitude is measured by the closeness of the relationship that a respondent is willing to accept or the social distance that he likes to maintain.
The respondent is to circle each of the seven categories to which he is willing to accept a particular group. This can know the respondent’s first reactions. A Bogardus-type scale is illustrated by an example below:
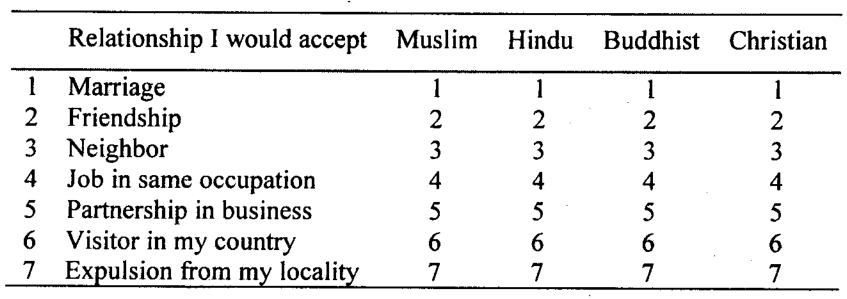
The seven categories indicate gradually increasing social distance. For a group, if a respondent circles’ 3′, he is very likely to circle ‘4’ and ‘5’ for the same group. If the respondent does not circle ‘3’,
he will probably not circle ‘1’ and ‘2’, which indicates an even closer relationship for the same group.
The score for the respondent will be the number of items he has circled. From this score, it is possible to ascertain which of the items the respondent has chosen.
In the Bogardus-type scale, the respondent has to indicate his first feeling. He has to react to each race as a group, not as an individual member of the group.
The scale distance can also be calculated mathematically. To do this, weights are attached to different categories of relationships.
Thus, if there are only 5 categories, the weights such as 1, 2, 3, 4, and 5 can be assigned to the first 5 categories, respectively.
The following procedure is generally adopted for the measurement of social distance:
- Place the weights and percentage response for each category in rows.
- Multiply the percentage response by its weight
- Add up the product, and this will be the required social distance.
One problem raised with this form of scale is that there is no way to determine the actual distance between the various points on the scale, and some points seem to be at a greater distance from the point next to them than others away.
The scores, however, are treated as equidistant. Nevertheless, such a scale – and many versions – may be useful if we study attitudes toward groups of “others.”
What is Parallel Forms Reliability?
Parallel forms reliability, also known as alternate forms reliability, is a measure of reliability used in psychometric testing to assess the consistency of results obtained from different test versions that are intended to measure the same construct.
How is Parallel Forms Reliability established?
To establish parallel forms reliability, two or more different test versions are created, each containing different items but designed to assess the same underlying construct. The reliability coefficient is calculated by administering both forms of the test to a sample of individuals and correlating their scores on the two forms.
What are the methods used to establish Parallel Forms Reliability?
Common methods include the Split-Half Method, where a single test is split into two halves, and their scores are correlated; the Equivalence of Form Method, where two different forms of a test are administered, and their scores are correlated; and the Counterbalancing Method, where multiple forms are administered to different subgroups of participants in a counterbalanced order.
How does Parallel Forms Reliability differ from Split-Half Reliability?
While both assess the consistency of a test, parallel forms reliability involves administering two different forms of a test to the same group of participants. In contrast, split-half reliability involves splitting a single test into two halves and correlating the scores of the two halves.
What are the advantages of Parallel Forms Reliability?
Parallel forms reliability can avoid problems inherent with test-retesting and ensures that changes in scores are reflective of the construct being measured rather than due to practice effects or familiarity with the items.
What are the potential drawbacks of Parallel Forms Reliability?
Some limitations include challenges in developing truly parallel forms, the time and resources required for creating multiple test versions, and the potential for order effects. Additionally, the two test versions are not guaranteed to be equally difficult.
In what situations is Parallel Forms Reliability commonly applied?
It is used in test development, to counteract practice effects, for equivalence across languages or cultures, in experimental manipulations, educational testing, psychometric testing, clinical assessments, cross-cultural research, experimental studies, and personnel selection.

