Total Utility (TU)
“Total utility is the total satisfaction obtained from all units of a particular commodity consumed over some time.”
For example, a person consumes 3 eggs and gains 50 units of total utility. This total utility is the sum of utilities from the successive units (30 units from the first egg, 15 units from the second, and 5 units from the third egg).
Summing up, total utility is the amount of satisfaction (utility) obtained from consuming a particular quantity of a good or service within a given period.
It is the sum of marginal utilities of each successive unit of consumption.
Formula:
TU(X) = ΣMU(X)
Marginal Utility (MU)
“Marginal utility means an additional or incremental utility. Marginal utility is the change in the total utility that results from one unit change in consumption of the commodity within a given period.”
For example, when a person increases the consumption of eggs from one egg to two eggs, the total utility increases from 30 units to 45 units. The marginal utility here would be the 15 units of the 2nd egg consumed.
Marginal utility, thus, can also be described as the difference between the total utility derived from one level of consumption and the total utility derived from another level of consumption.
Formula:
MU = ΔTU / ΔQ
Or, in other words, MU(n) = TU(n) – TU(n-1)
Relationship between Total Utility (TU) and Marginal Utility (MU):
It may be noted that as a person consumes more and more units of a commodity, the marginal utility of the additional units begins to diminish but the total utility goes on increasing at a diminishing rate.
When the marginal utility comes to zero or we say the point of satiety is reached, the total utility is the maximum.
If consumption is increased further from this point of satiety, the marginal utility becomes negative, and total utility begins to diminish.
The relationship between total utility and marginal utility is now explained with the help of the following schedule and a graph.
Schedule
| Units of Apples | Total Utility in units | Marginal Utility in units |
| Consumed Daily | Per Day | Per Day |
| 1 | 7 | 7 |
| 2 | 11 | 4 (11-7) |
| 3 | 13 | 2 (13-11) |
| 4 | 14 | 1 (14-13) |
| 5 • | 14 | 0 (14-14) |
| 6 | 13 | -1 (13-14) |
The above table shows that when a person consumes no apples, he gets no satisfaction. His total utility is zero. In case he consumes one apple a day, he gains seven units of satisfaction. His total utility is 7 and his marginal utility is also 7.
In case he consumes a second apple, he gains. extra 4 units (MU). Thus giving him a total utility of 11 units from two apples.
His marginal utility has gone down from 7 units to 4 units because he has less craving for the second apple.
The same is the case with the consumption of the third apple. The marginal utility has now fallen to 2 units while the total utility of three apples has increased to 13 units (7 + 4 + 2).
In case the consumer takes the fifth apple, his marginal utility falls to zero units and if he consumes the sixth apple also, his marginal utility goes to negative. The total utility and marginal utility are plotted in the figure below:
Diagram/Curve:
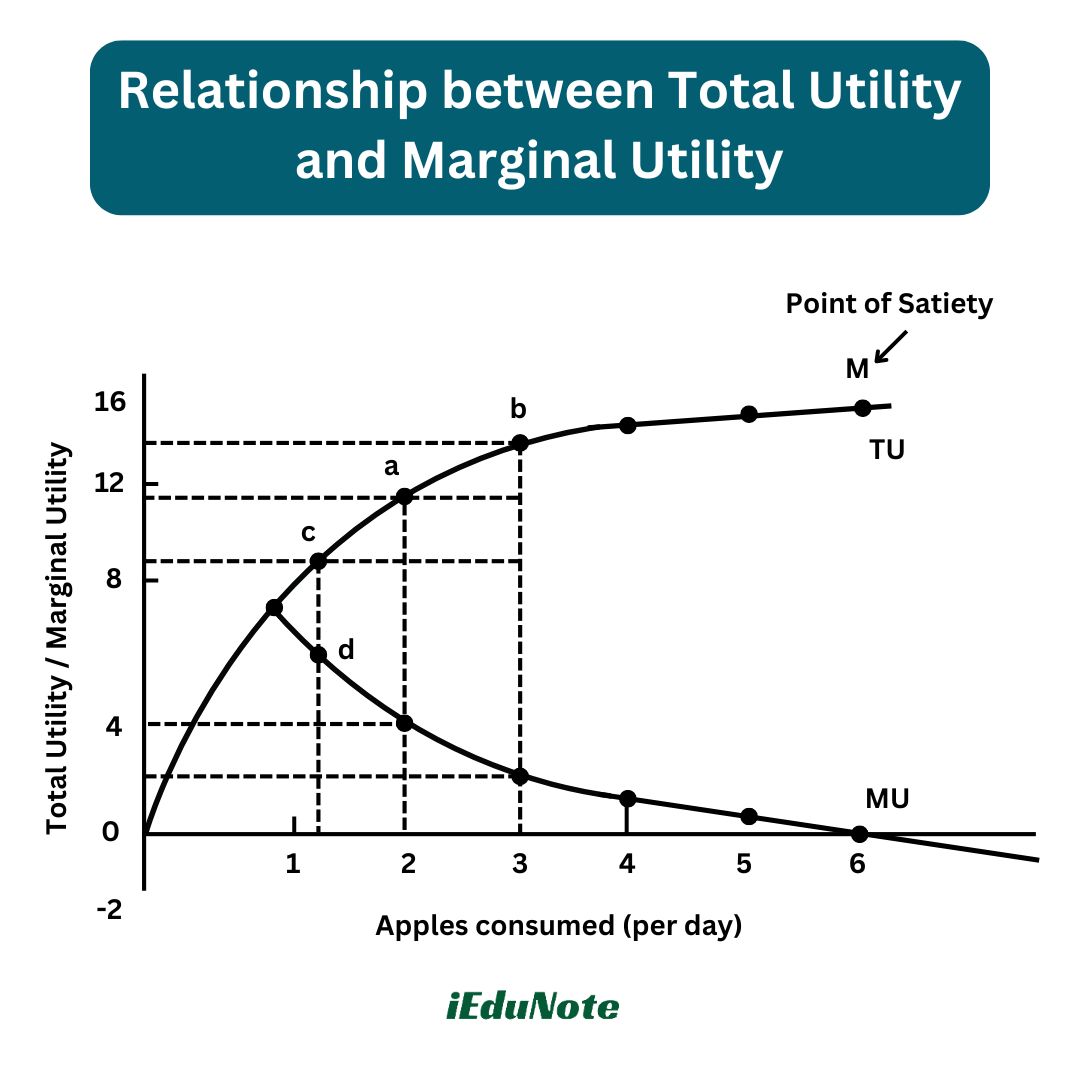
- The total utility curve starts at the origin as zero consumption of apples yields zero utility.
- The TU curve reaches its maximum or peak at M when MU is zero.
- The MU curve falls through the graph. A special point occurs when the consumer consumes the fifth apple. He gains no marginal utility from it. After this point, marginal utility becomes negative.