Pareta, Hicks, Allen, etc., economists advocated an alternative view of Marshallian utility analysis regarding consumer behavior and the nature of demand termed the theory of indifferent curve.
The indifference curve is the pathway of some points, each of which indicates the combination of two commodities, and in each of the combinations, the consumer satisfies an equal or gets the same level of
satisfaction from every point of the curve.
Suppose two goods are apple and orange; of these two goods, an indifference schedule of equal satisfaction giving different combinations is given below:
| Combination | Apple | Orange | Utility |
| A | 1 | 15 | U10 |
| B | 2 | 11 | U10 |
| C | 3 | 8 | U10 |
| D | 4 | 6 | U10 |
| E | 5 | 5 | U10 |
From the above schedule, we see that combination A is of 1 apple and 15 oranges, 2nd is 2 apples and 11 oranges, and the 3rd combination is of 3 apples and 8 oranges, and so on, all of which give an equal level of utility.
if the above schedule is converted to a curve, then it will be an indifference curve
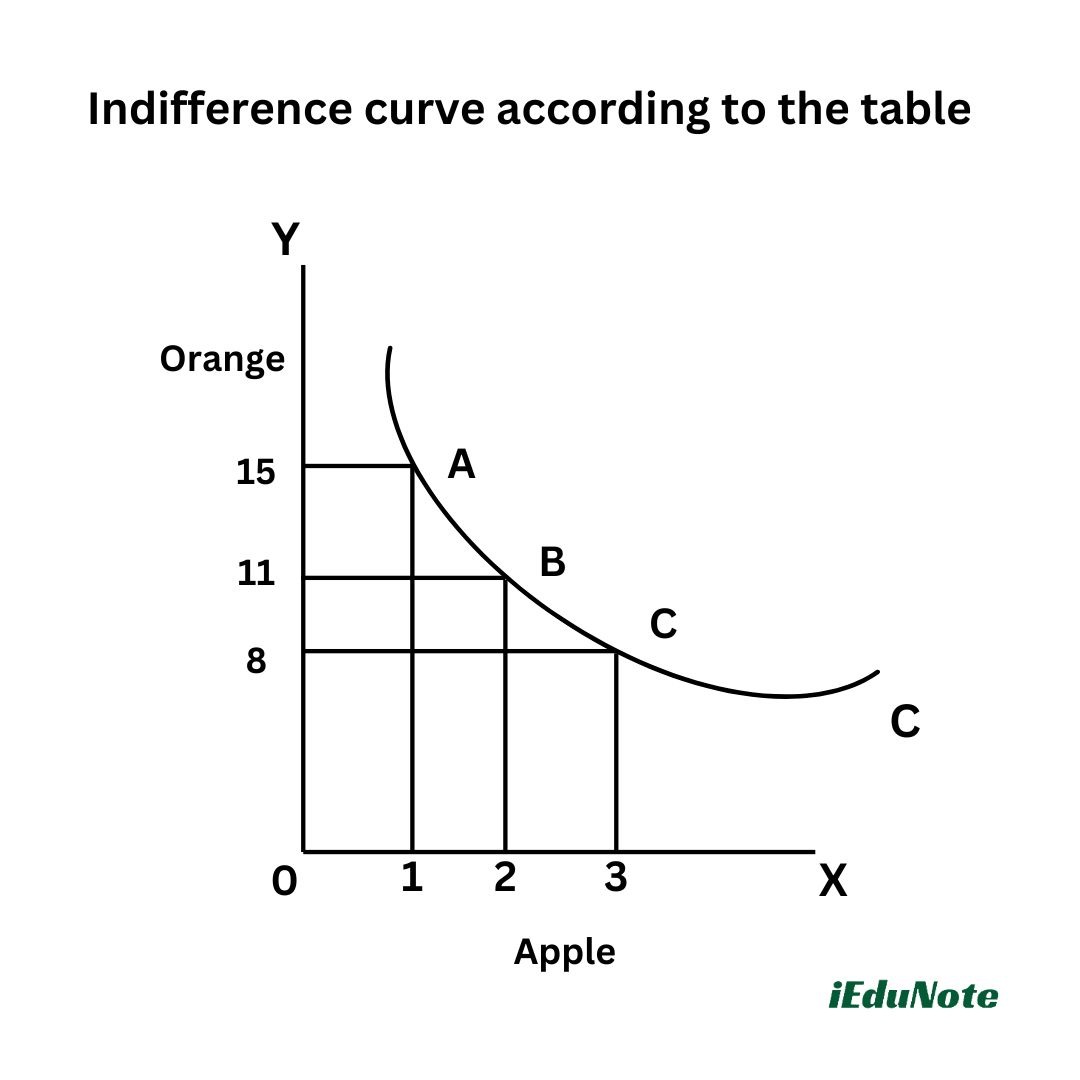
In the graph, the OX axis indicates several apples and the OY axis indicates several oranges. Point A is indicated as the combination of 15 oranges and 1 apple.
By point B the combination of 11 oranges and 2 apples is indicated and by point C the combination of 8 oranges and 3 apples is indicated.
The curve obtained by connecting the points A, B, and C is the indifference curve.
Therefore, the curve indicating different combinations of two commodities of equal satisfaction is termed an indifference curve.
Characteristics of the indifferent curve:
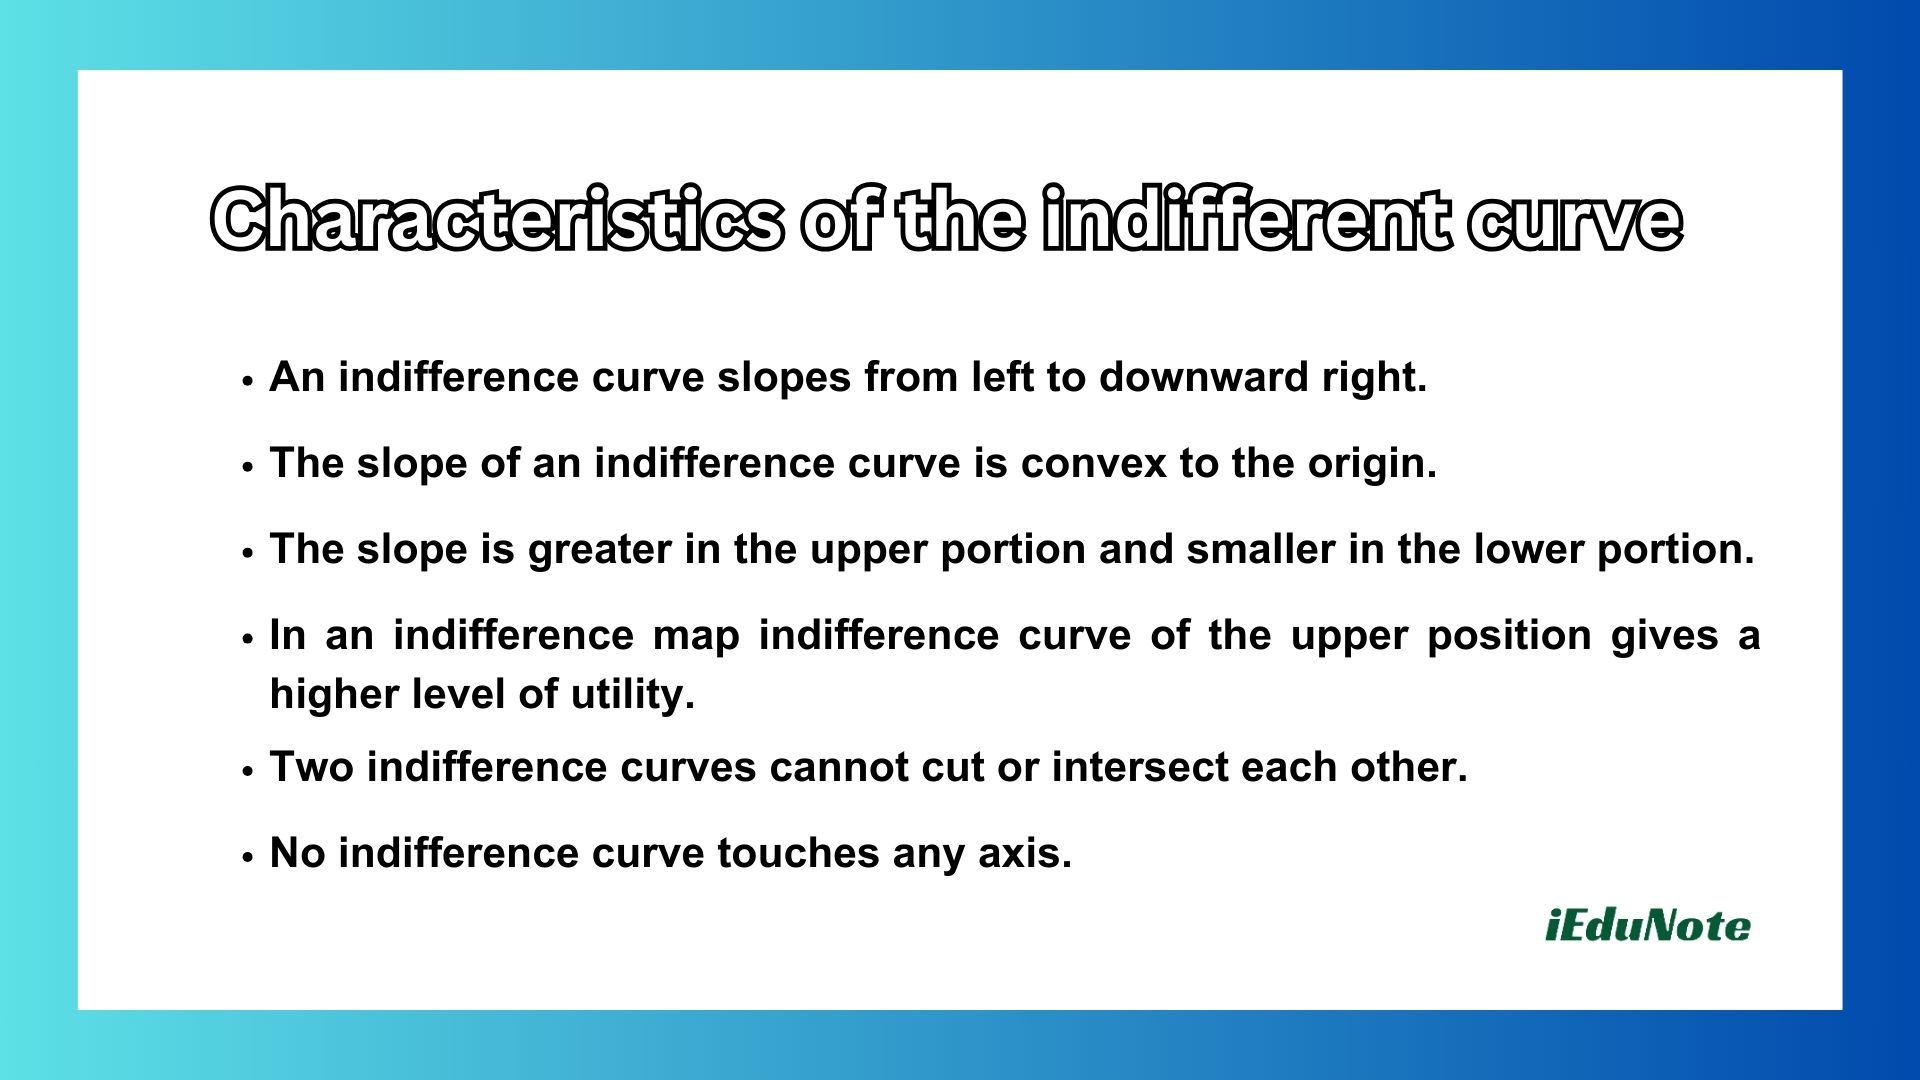
An indifference curve has some basic characteristics, which are as follows:
- 1. An indifference curve slopes from left to downward right.
- 2. The slope of an indifference curve is convex to the origin.
- 3. The slope is greater in the upper portion and smaller in the lower portion.
- 4. In an indifference map, the indifference curve of the upper position gives a higher level of utility.
- 5. Two indifference curves cannot cut or intersect each other.
- 6. No indifference curve touches any axis.
1. The indifference curve is downward slopping to the right
The right characteristic of an indifference curve is that it moves downward to the right.
The significance of this type of movement is that the points on the curve are equal levels of satisfaction, and the points are different combinations of two commodities.
Therefore, to maintain an equal level of utility, if one commodity is to increase, another must decrease, and this type of situation can be shown by only a curve downward sloping to the right.
We can graphically show it
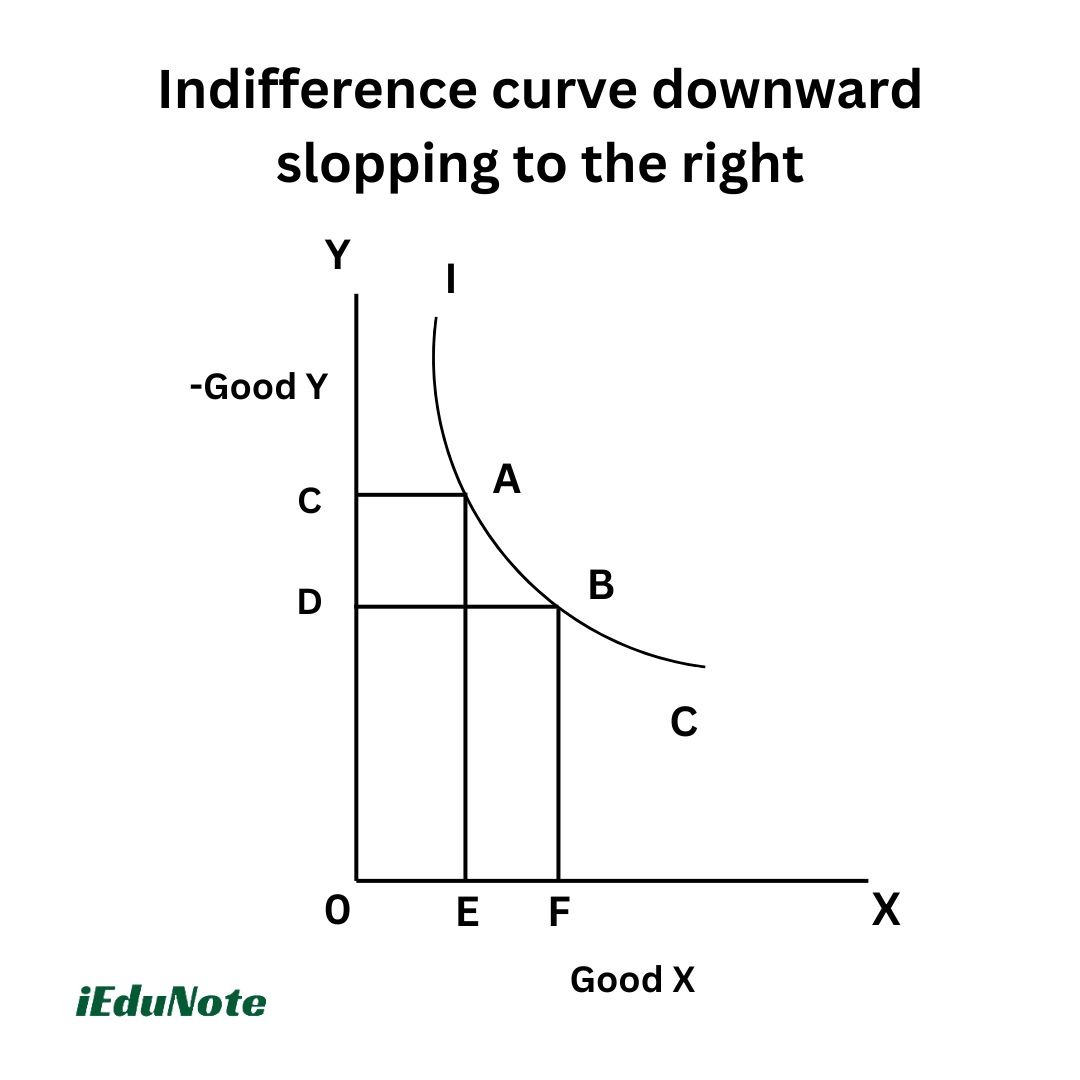
In the above figure, IC is an indifference curve. In the IC indifference curve from point A to B, the quantity of good X increases, and for that, the quantity of good Y decreases.
For that, the utility at point A and the utility at point B remain the same.
There is an alternative shape 1C curve other than this shape, like the IC curve parallel to the OX axis or parallel to the OY axis, is not possible to give an equal level of utility.
Therefore, the indifference curve slopping from left to downward right is the only normal shape of the IC curve.
2. Indifference Curve in Convex to the Origin
The cause behind it is the effectiveness of diminishing the marginal rate of substitution.
When a consumer wants to increase the consumption of one good, then he must decrease the consumption of another good.
However, the rate of substitution is not always equal. Rather, it is at a diminishing rate. It is shown below by graph:
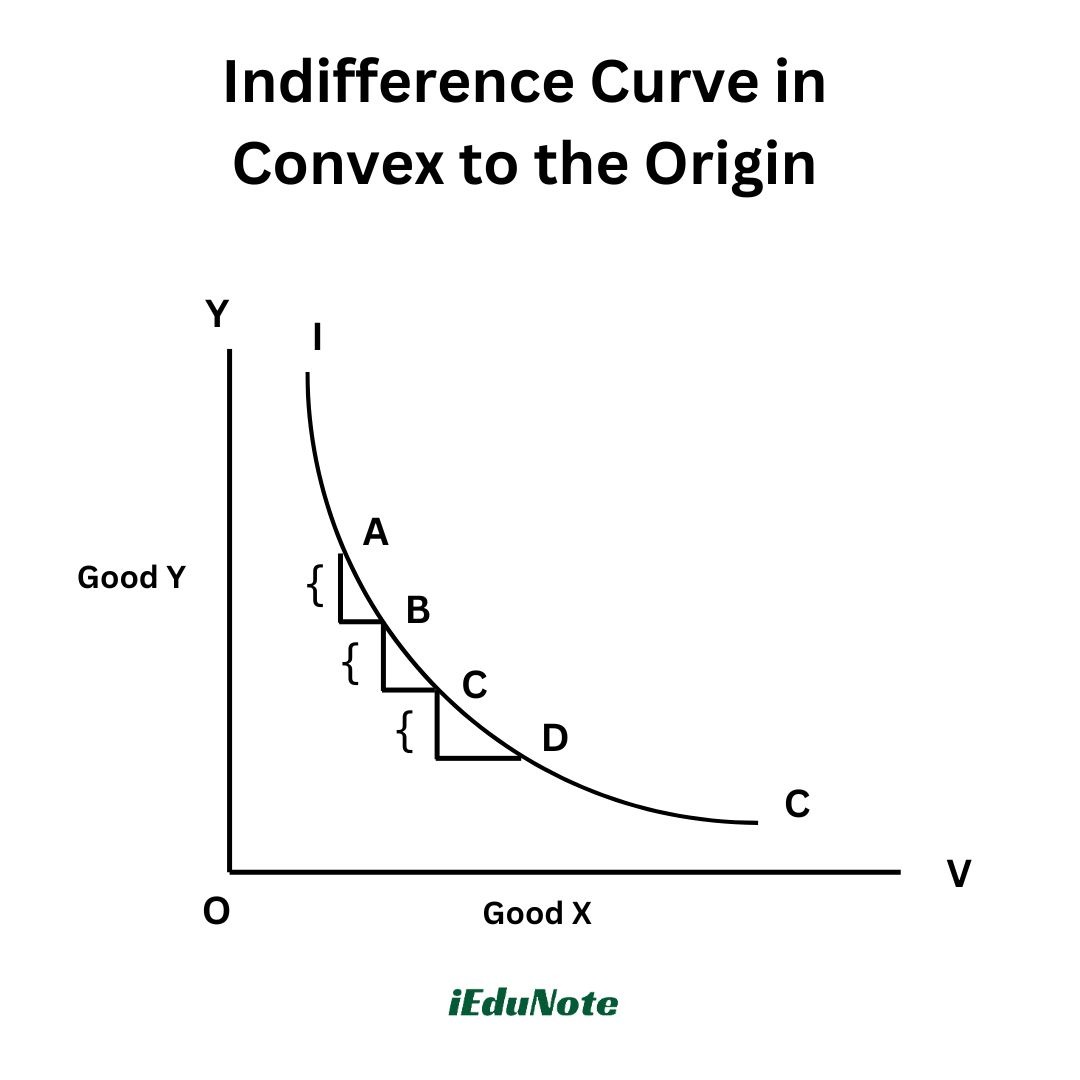
Here in the graph we can observe that the marginal rate of substitution from point A to B is less in consumption with the marginal rate ot substitution from point B to point C.
From C to D the rate of marginal substitution is shorter.
Therefore, for increasing the consumption of good X, the decrease of Y is by greater rate. Therefore, from point A to B the slope of the curve is greater.
Similarly, from B to C, comparatively for increasing the same amount X good less amount of Y than previous is to be forgone. For that, the slope of the IC curve is less here.
Thus, from point A to B, B to C, and from point C to D in every case, the slope of the IC curve decreases. From these
characteristics of the IC curve, we may conclude that the IC curve is convex to the origin.
3. The Slope of IC Curve is Greater in the Upper Part and Smaller in the Lower Part
When an indifference curve moves from left downward to right then the rate of forgone of Y for increasing a particular good X decreases.
For that, the slope of an indifference curve is greater in the upper part of IC curve and comparatively by smaller in the lower part.
4. IC of Upper Position Gives Higher Level of Satisfaction or Utility
In the same indifference map, the right-hand side and upper position of IC give comparatively more utility or satisfaction than the points on the left-hand side and lower position of IC’s curve .
That is, lower (higher) the indifference curve, lower (higher) is the level of satisfaction. This is shown by graph:
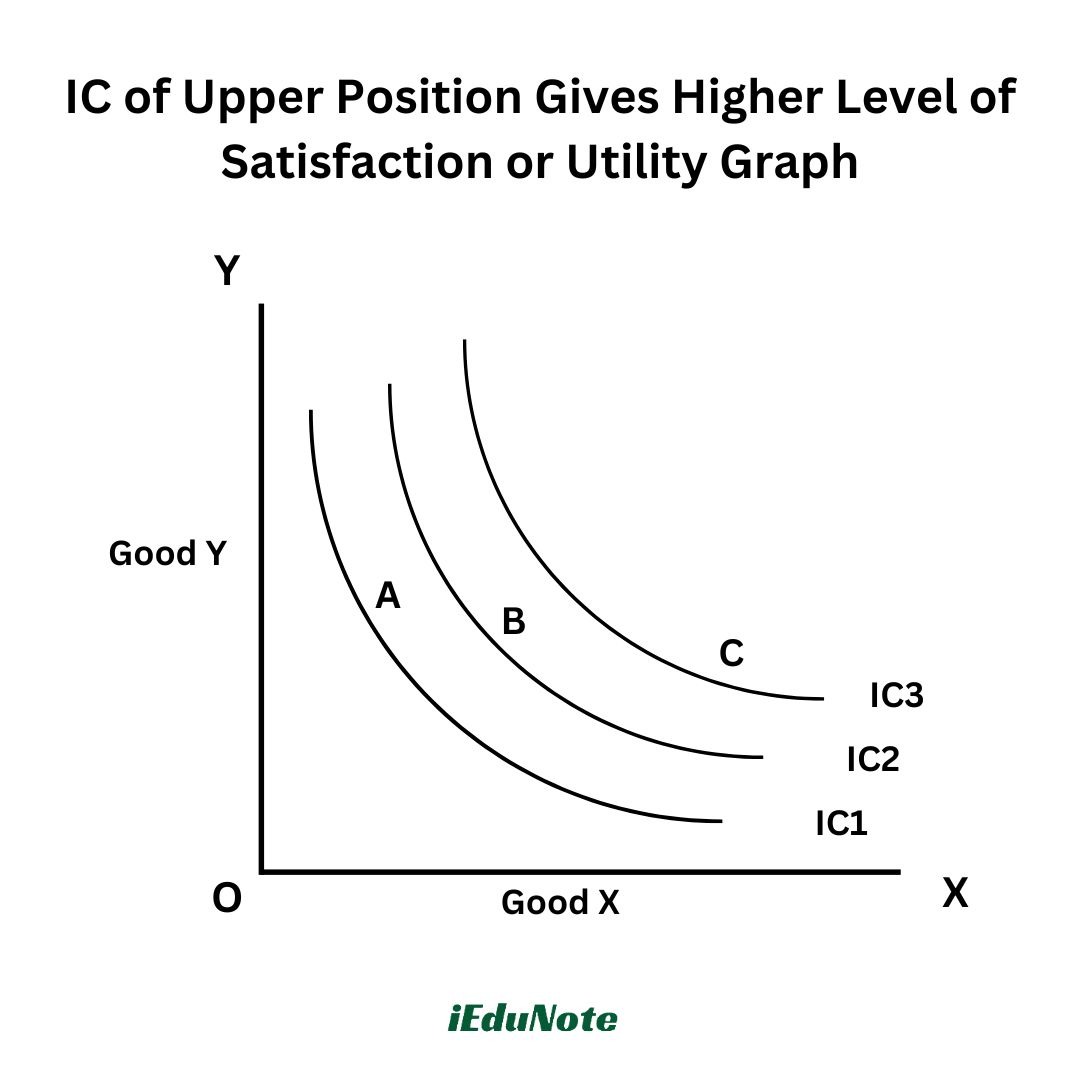
In the figure from point A to B and from point B to C both X and Y goods are at a greater amount obtained by the consumer.
5. Two Indifference Curves Cannot Intersect Each Other
Two IC curve do not intersect each other. Because each and every indifference curve indicates a separate level of satisfaction of the consumer.
Higher level of indifference curve indicates higher preferential state of a consumer than the lower level of indifference curve.
If two indifference curves intersect one another then their intersecting point will indicate the common point which will give equal level of satisfaction.
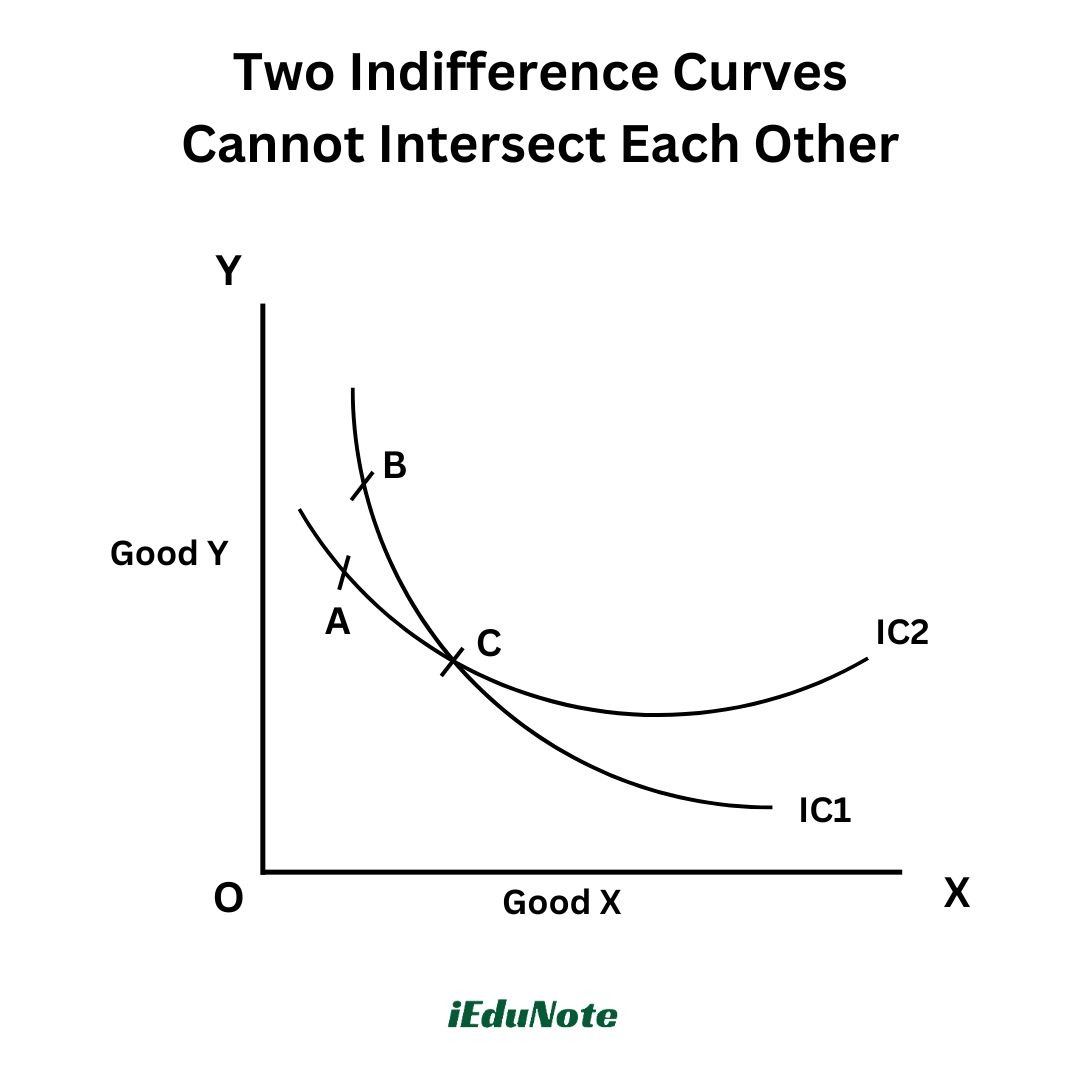
From indifference curve IC >
Satisfaction in B = Satisfaction in C……………………. (i)
From indifference curve 1C2
Satisfaction in A = Satisfaction in C……………………. (i)
From equation no (i) and (ii), we get
Satisfaction in A = Satisfaction in B
If two indifference curves intersect each other, then level of satisfaction at point A and at point B would be the same.
But, by the definition of indifference curves, it is not possible. Therefore, the indifference curves cannot intersect each other.
How to construct an indifference curve?
In an indifference curve from every point and from every combination of two commodities a consumer will get a particular level of utility.
Therefore, indifference curve is derived from a utility function. In a utility function the utility is fixed up for that given level of satisfaction; different combinations of two commodities are obtained.
Then using these combinations an indifference curve is drawn.
Suppose, Uxy=XY is a utility function
Here, X and Y are two goods
And the given utility Uxy= 6
There the utility function 6= XY
XY=6
Y= 6/X
Here, subject to different values of X, different values of Y is obtained. For different combinations of X and Y, utility remains fixed.
In this case Uxy= 6, utility is fixed
For considering different values of X different value of Y is obtained
If X= 1 then Y = 6/1 = 6
If X = 2 then Y = 6/2 = 3
If X = 3 then Y = 6/3 = 2
Using different quantities of X and Y the following schedule is prepared:
| Combination | Good X | Good Y | Utility earned |
| A | 1 units | 6 units | 6 |
| B | 2 units | 3 units | 6 |
| C | 3 units | 2 units | 6 |

Indifference Map:
If in a figure, more than one indifference curve is placed to indicate different levels of satisfaction of a consumer, then it is termed as an indifference map.
Every point on an indifference curve gives an equal level of satisfaction. Yet a point on a higher level of indifference curve gives a higher level of satisfaction. The indifference map is shown below
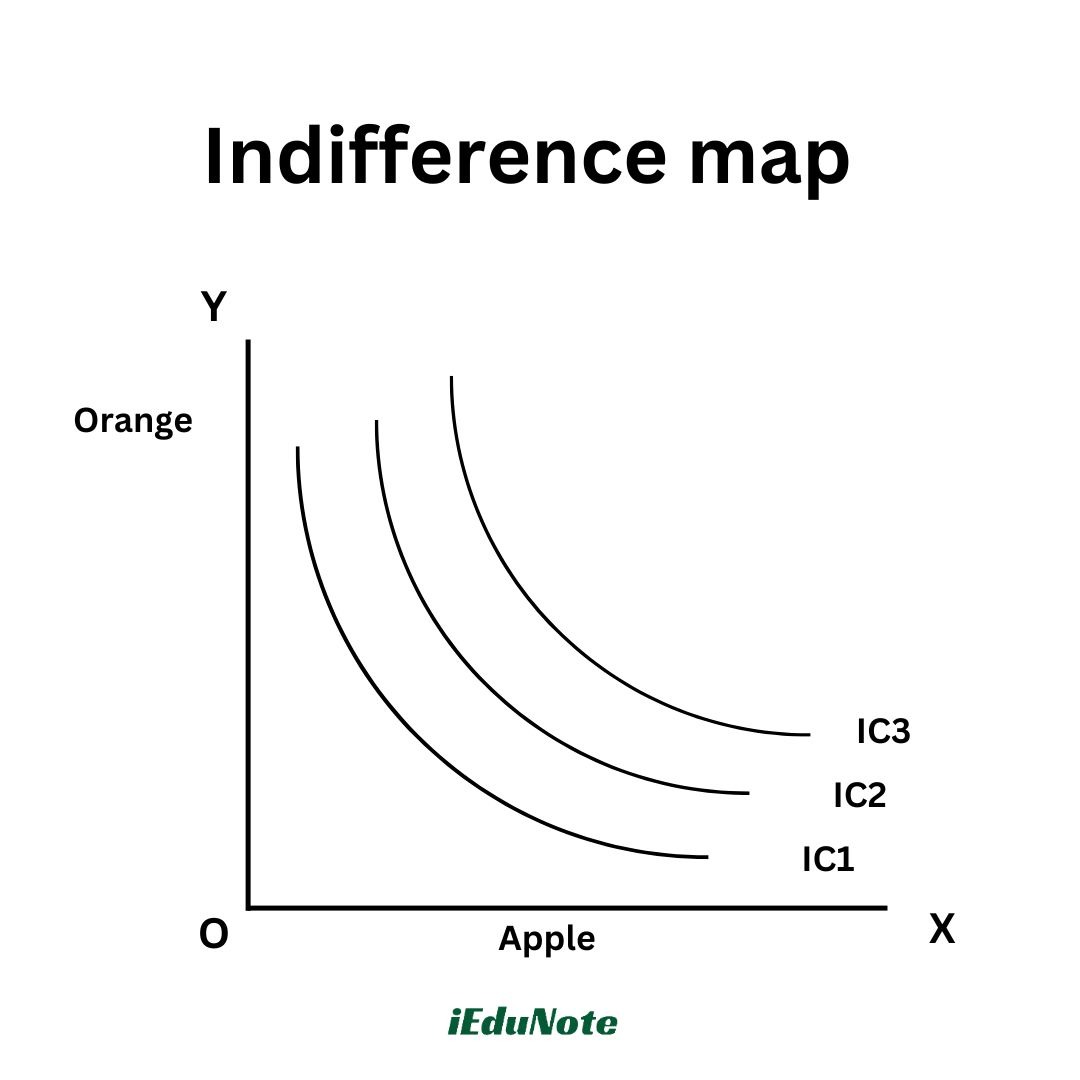
In the above figure there are three indifference curves like ICi, IC2, and IC3. The point on the indifference curve IC2 gives comparatively more satisfaction than the points on the IC1 indifference curve.
Similarly the points on the third indifference curve like IC3 gives comparatively more satisfaction than the points on IC2 indifference curve, in this way if in a picture more than one indifference curve is drawn then it is termed as indifference map.
Marginal rate of substitution
The concept of the marginal rate of substitution is related to the indifference curve. In the indifference curve from different points indicating different combinations of two commodities, the consumer earns an equal level of utility.
Maintaining an equal level of utility, substitution, or exchange between the two commodities is termed a marginal rate of substitution (MRS).
Therefore, we may say that for maintaining the given amount of utility of each combination the rate at which one commodity is to be forgone for increasing one unit of another commodity is termed as marginal rate of substitution.
MRS Indicates the transfer of consumer’s consumption from one point on the indifference curve to another
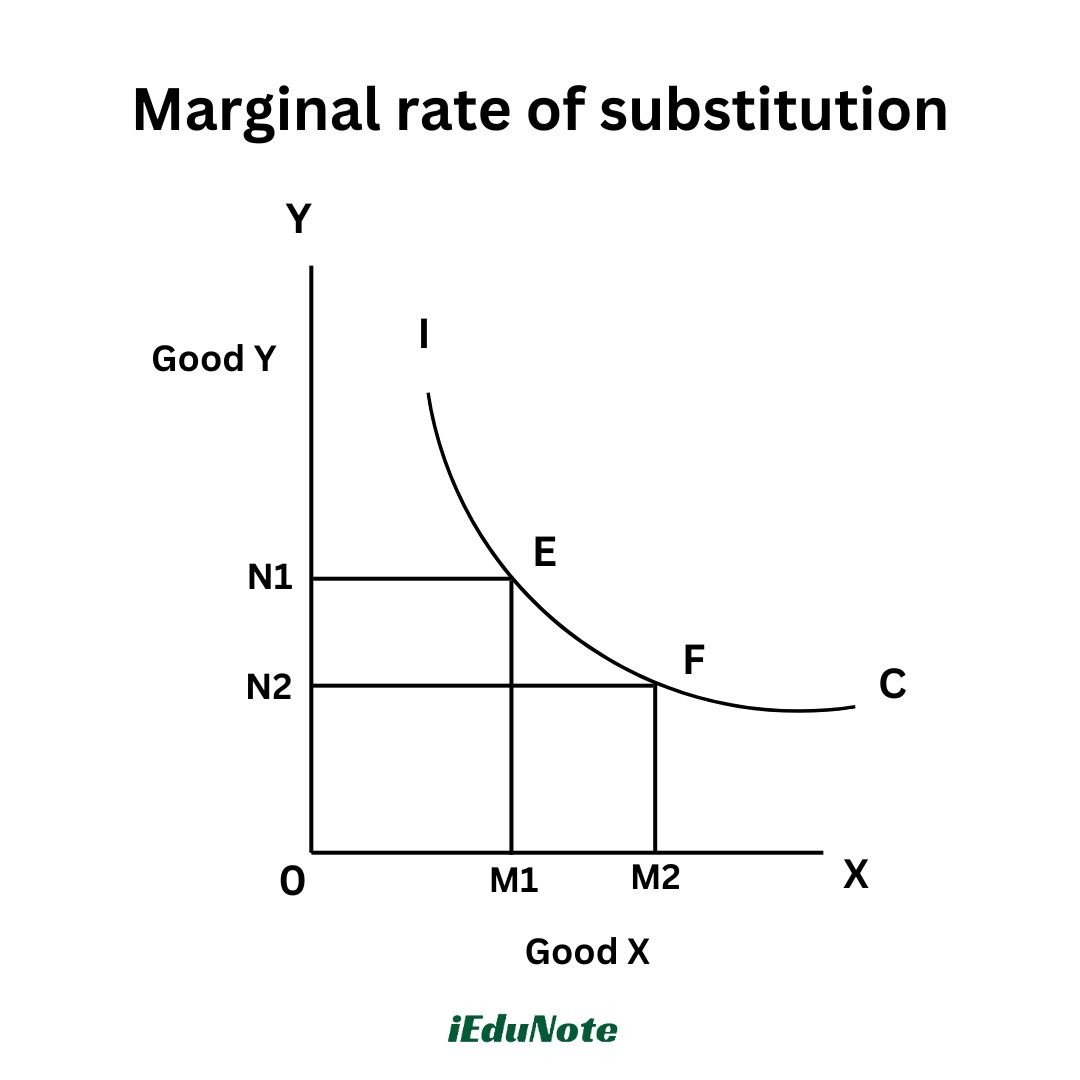
In the figure, X good is indicated along the horizontal axis, and Y good is indicated alone on the vertical axis. IC is an indifference curve.
On the IC curve at the points E and F the consumer earns equal level of utility. At point E the consumer consumes OM) amount of X good and ONi amount of Y good.
If the consumer shifts from point E to F then he can consume X good by M|M2 amount as extra. But he has to forgo N|N2 amount of Y good.
That means, the consumer will substitute M|M2 amount of X good for N|N2 amount of Y good. The marginal rate of substitution can be shown by the following formula MRS xy = A Y/ A X
As the consumer forgo N|N2unit of Y good for increasing M|M2unit of X good, therefore, AY will be negative and AX will be positive.
So the formula can be expressed in this way {MRS xy} = ON2– ON!/OM2-OMi

