Quantitative analysis of financial distress generally involves two statistical methods; regression and discriminant analysis. These methods are employed in predictive distress models.
Regression analysis uses past data to forecast future values of dependent variables. In contrast, the discriminant analysis produces an index that allows observation to be classified into one of several a priori groupings.
Bankers, auditors, management consultants, the legal profession, and many other users employ these database systems as important risk analysis and distress prediction components.
Of the statistical models popular today, ad hoc and otherwise, Edward Altman’s Z-score models are probably the Johann Sebastian Bach of the genre.
Let’s begin our study by examining the Z-score model. Altman’s original data sample drew from 66 sample firms, half of which had filed for bankruptcy.
All businesses in the database were manufacturers, and small firms with less than $1 million were eliminated.
Altman’s Z Score

The 1968 model used discriminant analysis to predict bankruptcy.
While the model was originally developed from samples of a closed industry environment manufacturing), it is reported to provide a very high distress predictive confidence for up to two years before failure in non-manufacturing firms.
Some other bankruptcy predictors have been published with some in use, but no distress models have been so thoroughly tested and widely accepted as this one.
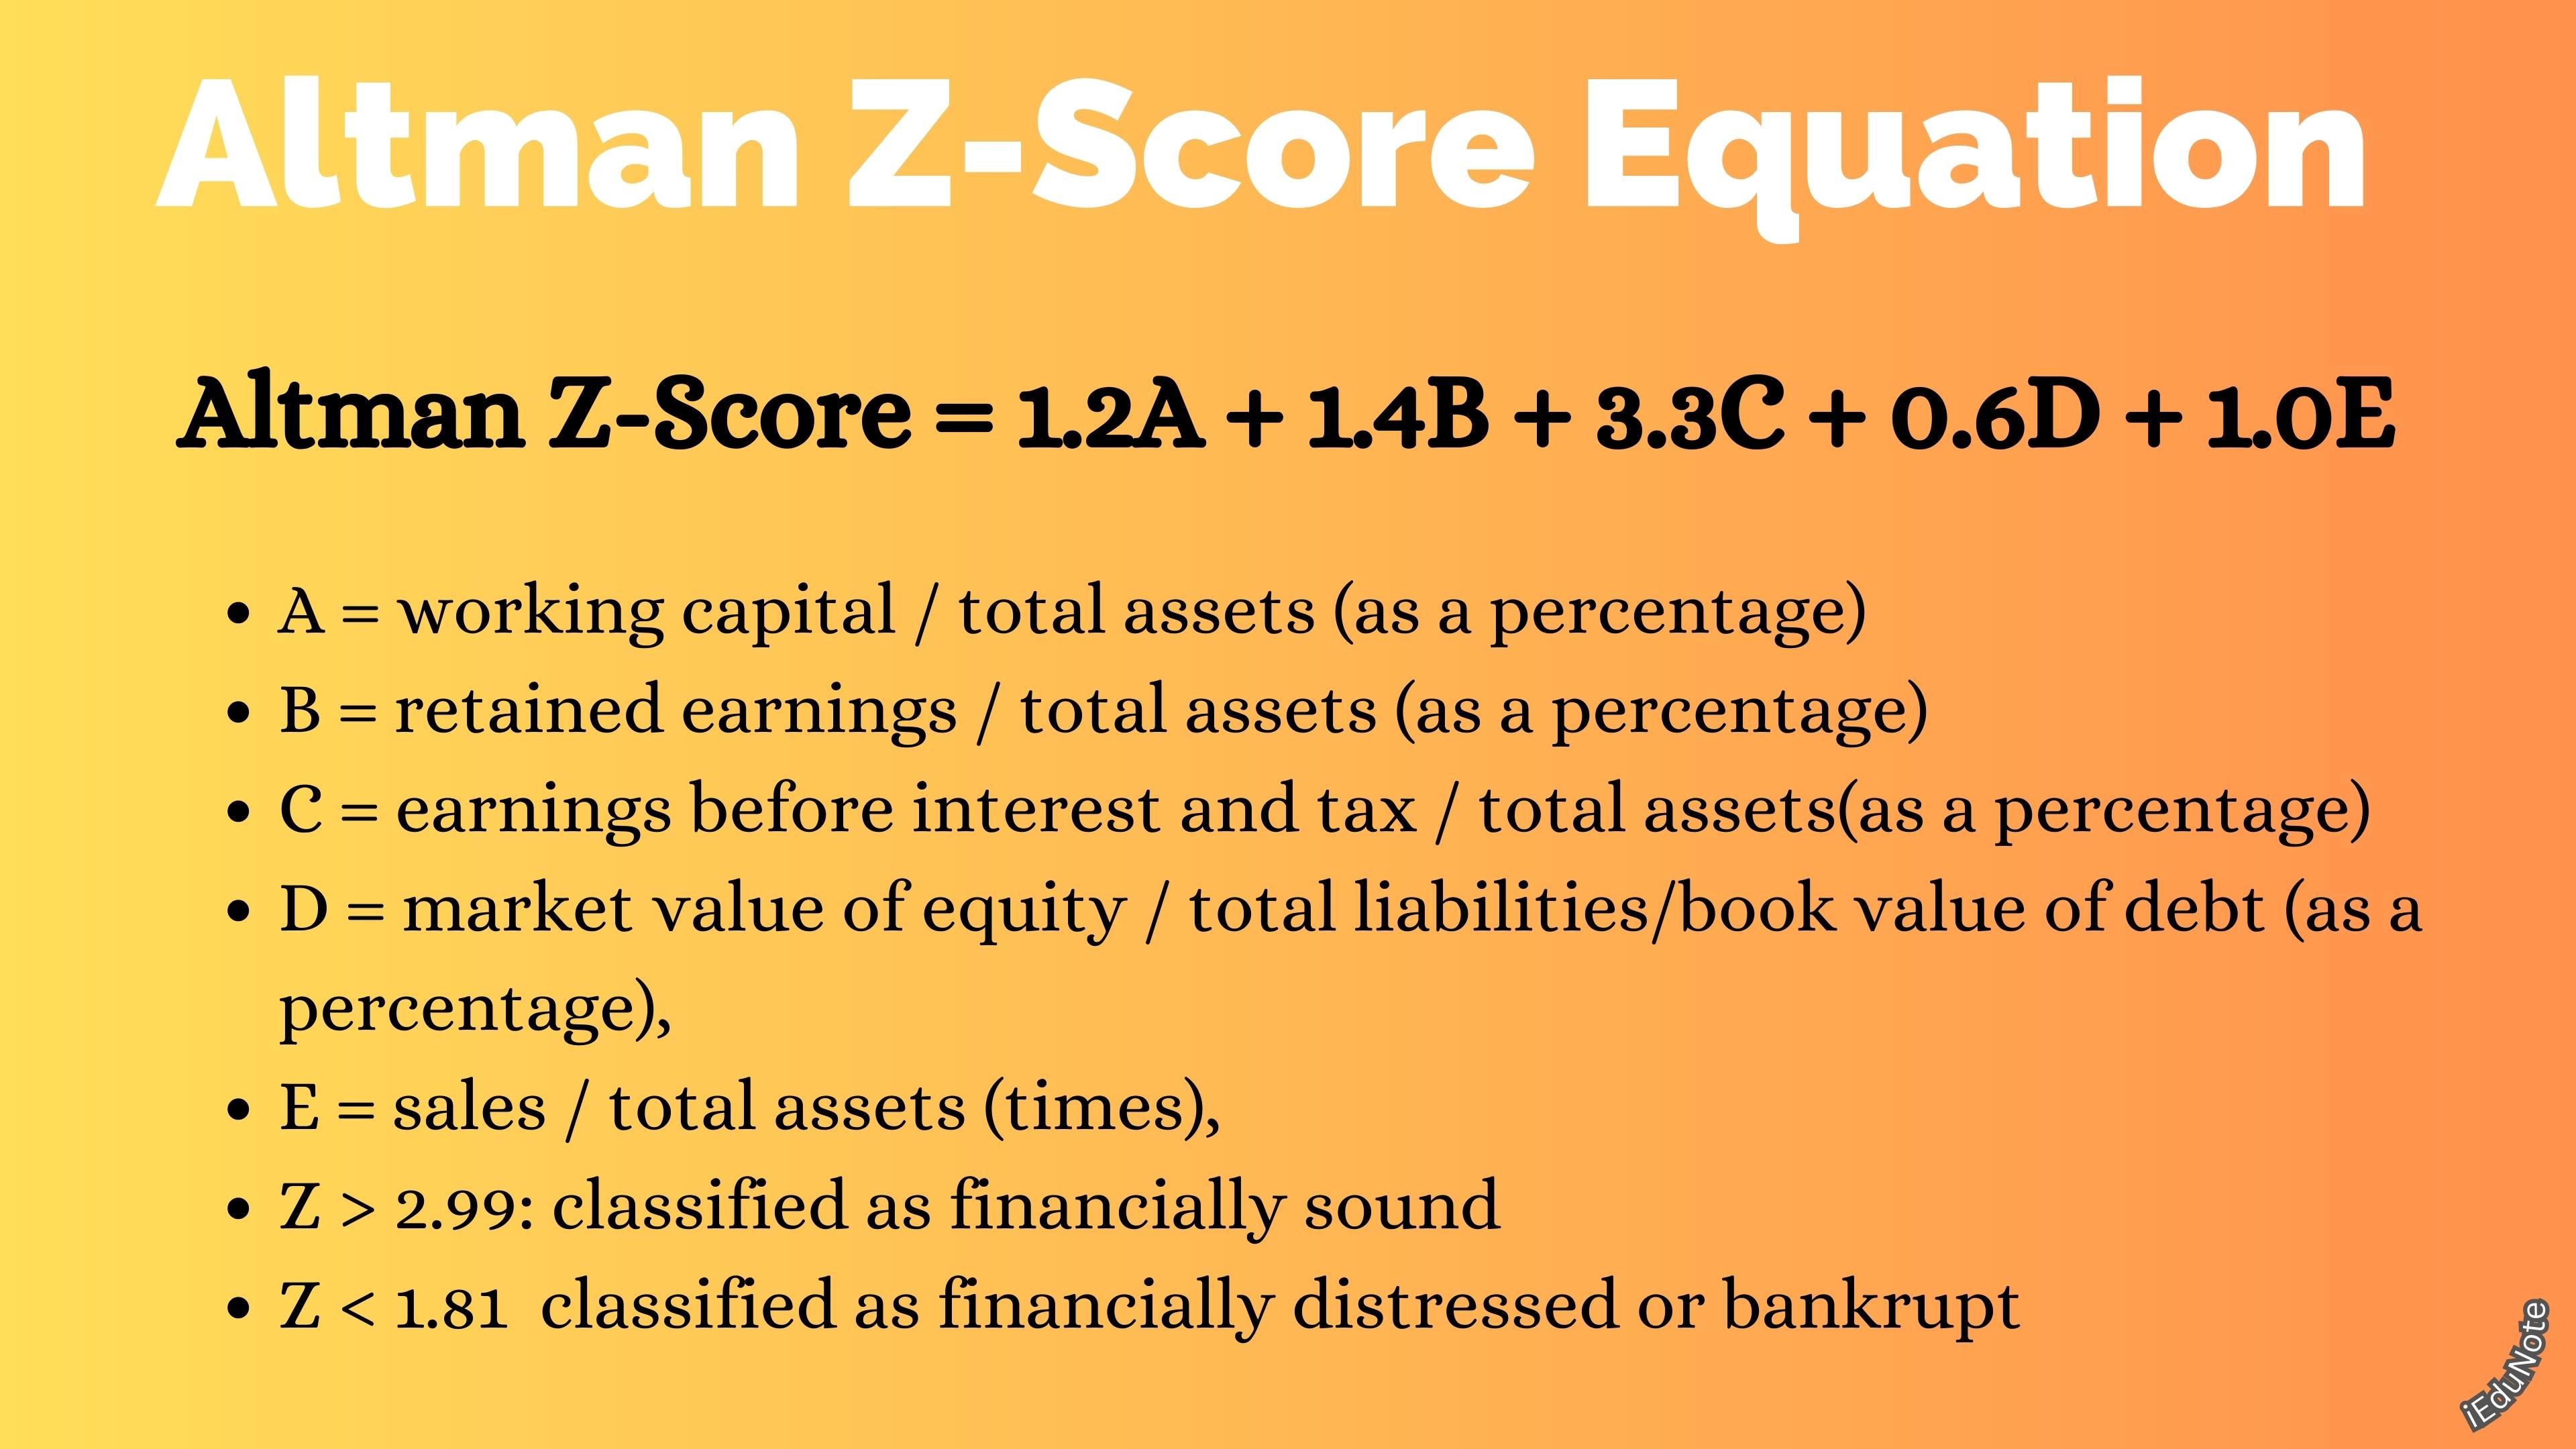
The discriminant function Z was found to be as follows:
Altman Z-Score = 1.2A + 1.4B + 3.3C + 0.6D + 1.0E
Where;
- A = working capital / total assets (as a percentage),
- B = retained earnings / total assets (as a percentage),
- C = earnings before interest and tax / total assets(as a percentage),
- D = market value of equity / total liabilities/book value of debt (as a percentage),
- E = sales / total assets (times),
- Z > 2.99: classified as financially sound.
- Z < 1.81 classified as financially distressed or bankrupt.
The model’s fabric lies in the predictive power of what I call the domino-multiplier syndrome and the asset management syndrome. The domino-multiplier syndrome holds for high (operating) leverage firms engaged in the production of goods.
A high degree of operating leverage implies that a relatively small change in sales results in a large change in net operating income.
For example, airlines operate with high operating leverage, requiring seating above a break-even load factor to cover fixed costs.
Similarly, firms borrowing to expand their fixed assets base run the risk of not covering fixed overhead if sales unexpectedly drop. The domino effect is propagated by large capital expenditures followed by disappointing sales.
Therefore, lenders should be extra cautious financing high-operating leveraged borrowers unless convinced healthy projected sales will end up being healthy projected sales will end up to healthy actual sales.
Stress testing by developing worst-case projections to establish that borrowers can safely withstand recessions or sharp sales reductions is a must, particularly for lower-rated credits.
The asset management syndrome implicit in the Z score clearly reveals that borrowers go bankrupt if assets such as inventory, receivables, and equipment grow out of control. Notice that total assets show up in the denominator of four out o five Z-score variables.
Distressed companies hold too many assets on their balance sheets, well out of proportion with operating requirements. The serious impact of redundant assets is also brought out in sustainable growth rates. Sustainable growth mathematics and Airman’s Z score link for this reason alone.