The choice of a statistical test to describe the strength of relationships between variables will largely depend on the level of measurement. Statistical measures of the strength of the relationship are called either the coefficient of association or the coefficient of correlation.
The former term is generally used when the variables are nominally measured and displayed in a contingency table.
Chi Square-Based Measures of Association
The latter term is generally used for variables measured on at least an interval (numerical) scale. For example, if we compute phi (discussed below) for two nominally measured variables (say, for example, sex and eye color), we call phi a measure of association.
On the other hand, if we compute r (discussed in an earlier chapter) for the numerical variables (say age and BMI), we call r a coefficient of correlation. In the following sections, we will discuss these measures in turn, starting with the measures of association first.
Phi Coefficient
Phi (^) coefficient is probably the most popular association coefficient for 2×2 contingency tables. This coefficient is also called the four-fold point coefficient. The formula for computing^ is
Phi (^) coefficient ranges from 0 to 1.0 and attempts to correct chi-squared proportionately to n, the total number of cases.
The coefficient does not suggest whether one variable causes the other, nor is there an indication of the direction of the relationship. As you can see, the computation of <j> is straightforward once we have the contingency table.
Cramer’s V
Cramer’s V is a modification of 0 for larger tables and has a range of up to 1.0 for tables of any dimension. It is computed where k is the lesser number of rows or columns. For a better understanding of the above formula, we rewrite it as
Contingency Coefficient
The contingency coefficient was developed with square tables with more than two rows and columns, for example, 3×3 or 4×4 tables. It is computed as;
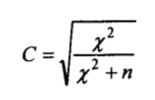
The contingency coefficient C equals 0 when the variables are independent. Its maximum value is always less than 1 and is determined by the table’s number of rows and columns. The maximum value for a square table (2×2 or 3×3) is calculated using the equation;
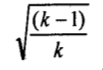
where k equals the number of rows or columns, whichever is less. For a 2×2 table, the maximum value would be attained with k=2:
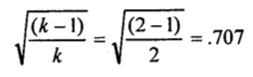
For a 3×3 table, the maximum value would be .816.
A disadvantage of the contingency coefficient, when the variables are neither independent nor perfectly related, is the difficulty of comparing it for tables of unequal size when r is not equal to c.
The fluctuations of C’s maximum value have led to the use of Cramer’s V, which can be used with both square and non-square tables of any dimension. V ranges from 0 when the variables are independent to 1 when they are perfectly related.
As with C and V, ϕ only requires nominal-level data and provides us with a measure of the strength but not the direction of the association since the sign will always be positive.
Cramer’s V is the most versatile of the three measures of the association since its range is always 0 to 1, and it can be used for a table of any dimension.
Example of Contingency Coefficient
The accompanying table shows the relationship between mothers’ educational attainment and the degree of malnutrition among 150 under-five children in a city. Compute C, V, and ϕ to interpret the results
| Degree of malnutrition | Low | Moderate | High | Total |
|---|---|---|---|---|
| Low | 5 | 10 | 35 | 50 |
| Moderate | 15 | 30 | 5 | 50 |
| High | 30 | 10 | 10 | 50 |
| Total | 50 | 50 | 50 | 150 |
The X2 value was computed as 66, which is highly significant (p<.001). Based on this value, we compute other measures:
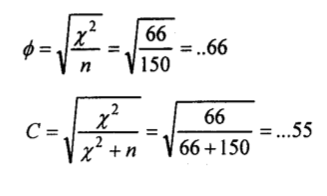
The contingency coefficient C= .55 leads to conclude that there is a moderately strong relationship between educational attainment and malnutrition since the maximum value for C in a 3×3 table is .816.
An examination of the data in the table also shows that the respondents who have completed higher education tend to have children with a low degree of malnutrition.
While V ranges between 0 and 1, V=.47 indicates a moderate relationship between the variables under investigation. With ordinal data, there are several alternative methods of measuring the association.
Among others, gamma, lamda, Kendal’s tau, Somer’s d are a few of them, which are less frequently used methods of measuring the association in contingency tables, and hence we skip to some frequently used methods.
The chi square test tells whether a relationship exists between two variables, but it does not tell us the relationship. This is achieved through correlation analysis.
Such analysis shows us how to determine both the nature and strength of the relationship between two variables.
The Spearman’s rho (rs) correlation is a popular and widely used ordinal measure rho correlates ranks between two ordered variables.
When both variables are measured on a numerical scale (e.g., weight, height), the most commonly used measure of the association is t h e P e r s o n ‘ s product-moment correlation coefficient (r).
What is the difference between a coefficient of association and a coefficient of correlation?
The term “coefficient of association” is generally used when the variables are nominally measured and displayed in a contingency table, while “coefficient of correlation” is used for variables measured on at least an interval (numerical) scale.
What is the Phi Coefficient, and when is it used?
Phi Coefficient is an association coefficient for 2×2 contingency tables, also known as the four-fold point coefficient. It ranges from 0 to 1.0.
How does Cramer’s V differ from the Phi Coefficient?
Cramer’s V is a modification of Phi for larger tables and can range up to 1.0 for tables of any dimension. It is more versatile than Phi and can be used for tables of any size.
What is the Contingency Coefficient designed for?
The Contingency Coefficient was developed for square tables with more than two rows and columns, such as 3×3 or 4×4 tables.
What does the chi-square test indicate in relation to two variables?
The chi-square test indicates whether a relationship exists between two variables, but it does not specify the nature of the relationship.
What is Spearman’s rho correlation used for?
Spearman’s rho correlation is used to correlate ranks between two ordered variables, especially when both variables are measured on a numerical scale.